Design System Style Guide
- Backgrounds: #E0E0E2 (Light Gray) / #B5BAD0 (Light Blue-Gray)
- Primary Actions: #81D2C7 (Mint Green)
- Secondary Actions: #7389AE (Medium Blue-Gray)
- Headings & Navigation: #416788 (Dark Blue-Gray)
Module 1: Master Data Management (Admin / Manager)
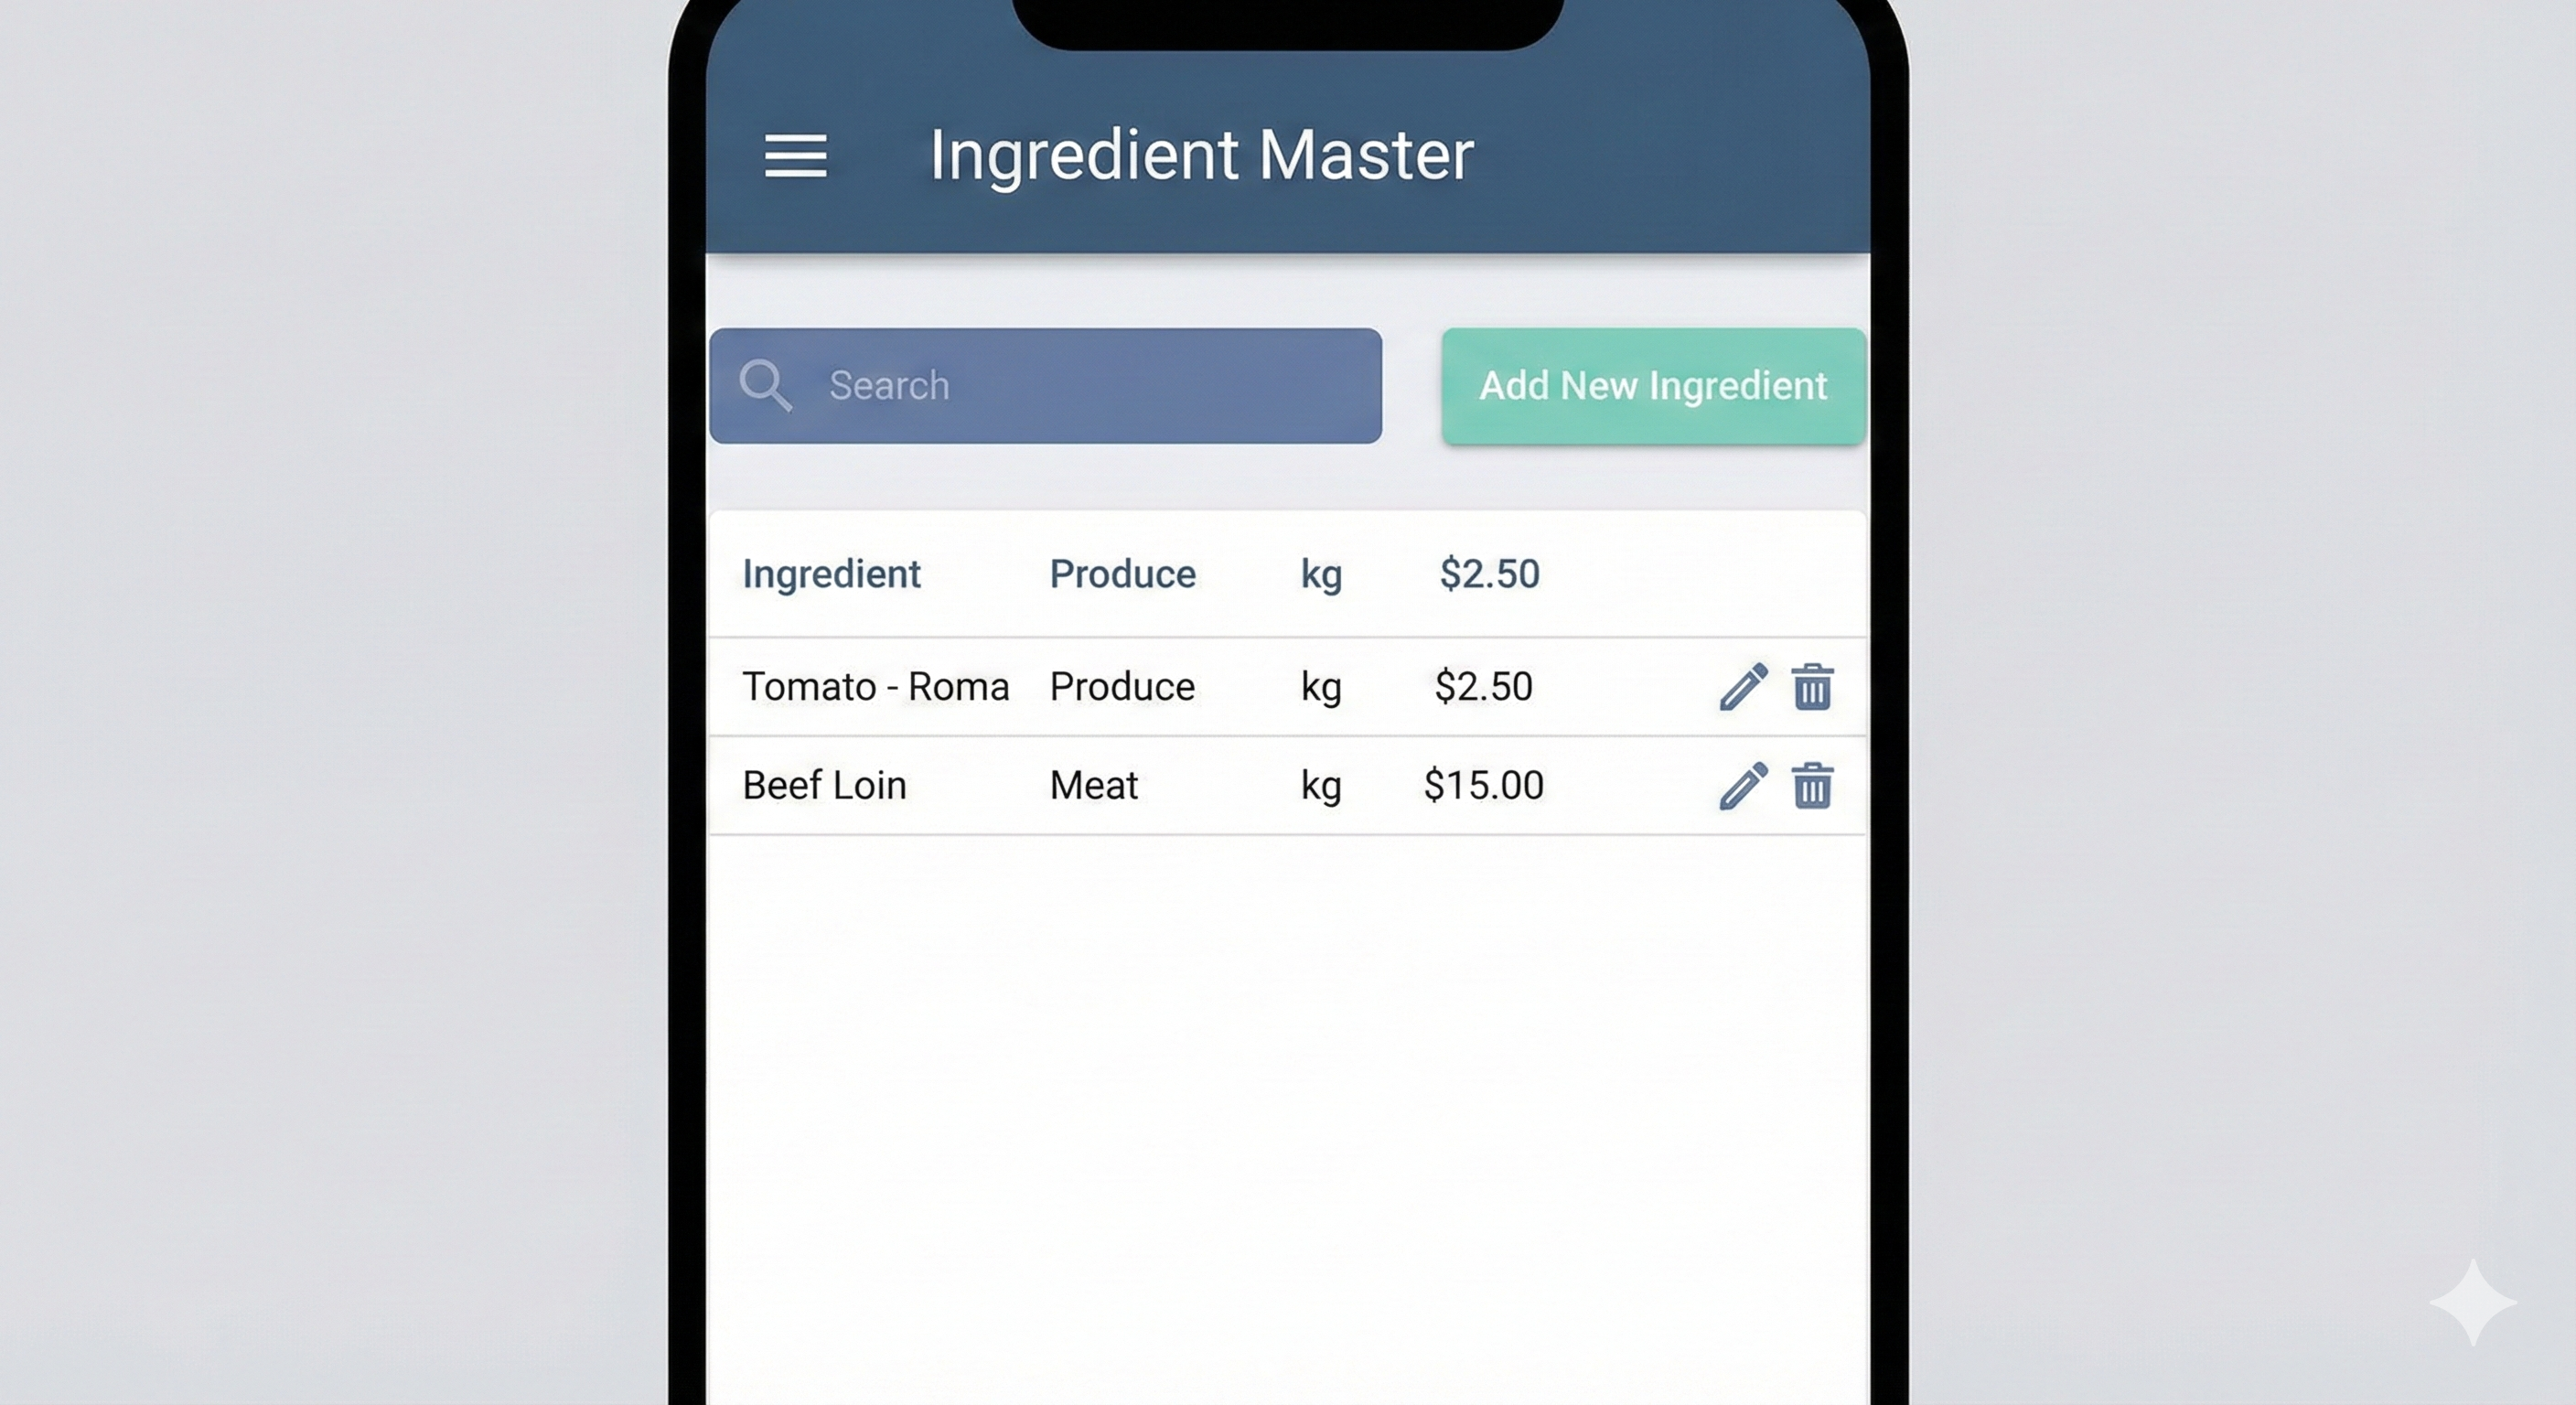
Screen 1.1: Ingredient Master List
View, search, and manage all raw ingredients.
- Search Bar & Filters: Filter by category (e.g., "Produce").
- Data Table: Columns for Item Name, Category, Base UOM, and Current Cost.
- Primary Action: "Add New Ingredient" Button (Mint Green).
Screen 1.2: Add/Edit Ingredient Details
Create or modify a single ingredient record.
Key Fields: Item Name, Category, Base UOM, Purchase UOM, Conversion, Yield %, Current Cost.
Screen 1.3: Menu Item & Recipe Editor
Define a sellable dish and its corresponding recipe.
Recipe Definition: Dynamic list of recipe lines with searchable ingredients and quantities.
Screen 1.4: Location Master
Screen 1.5: Supplier Master
Module 2: Inflow Transactions (Staff / Clerk)
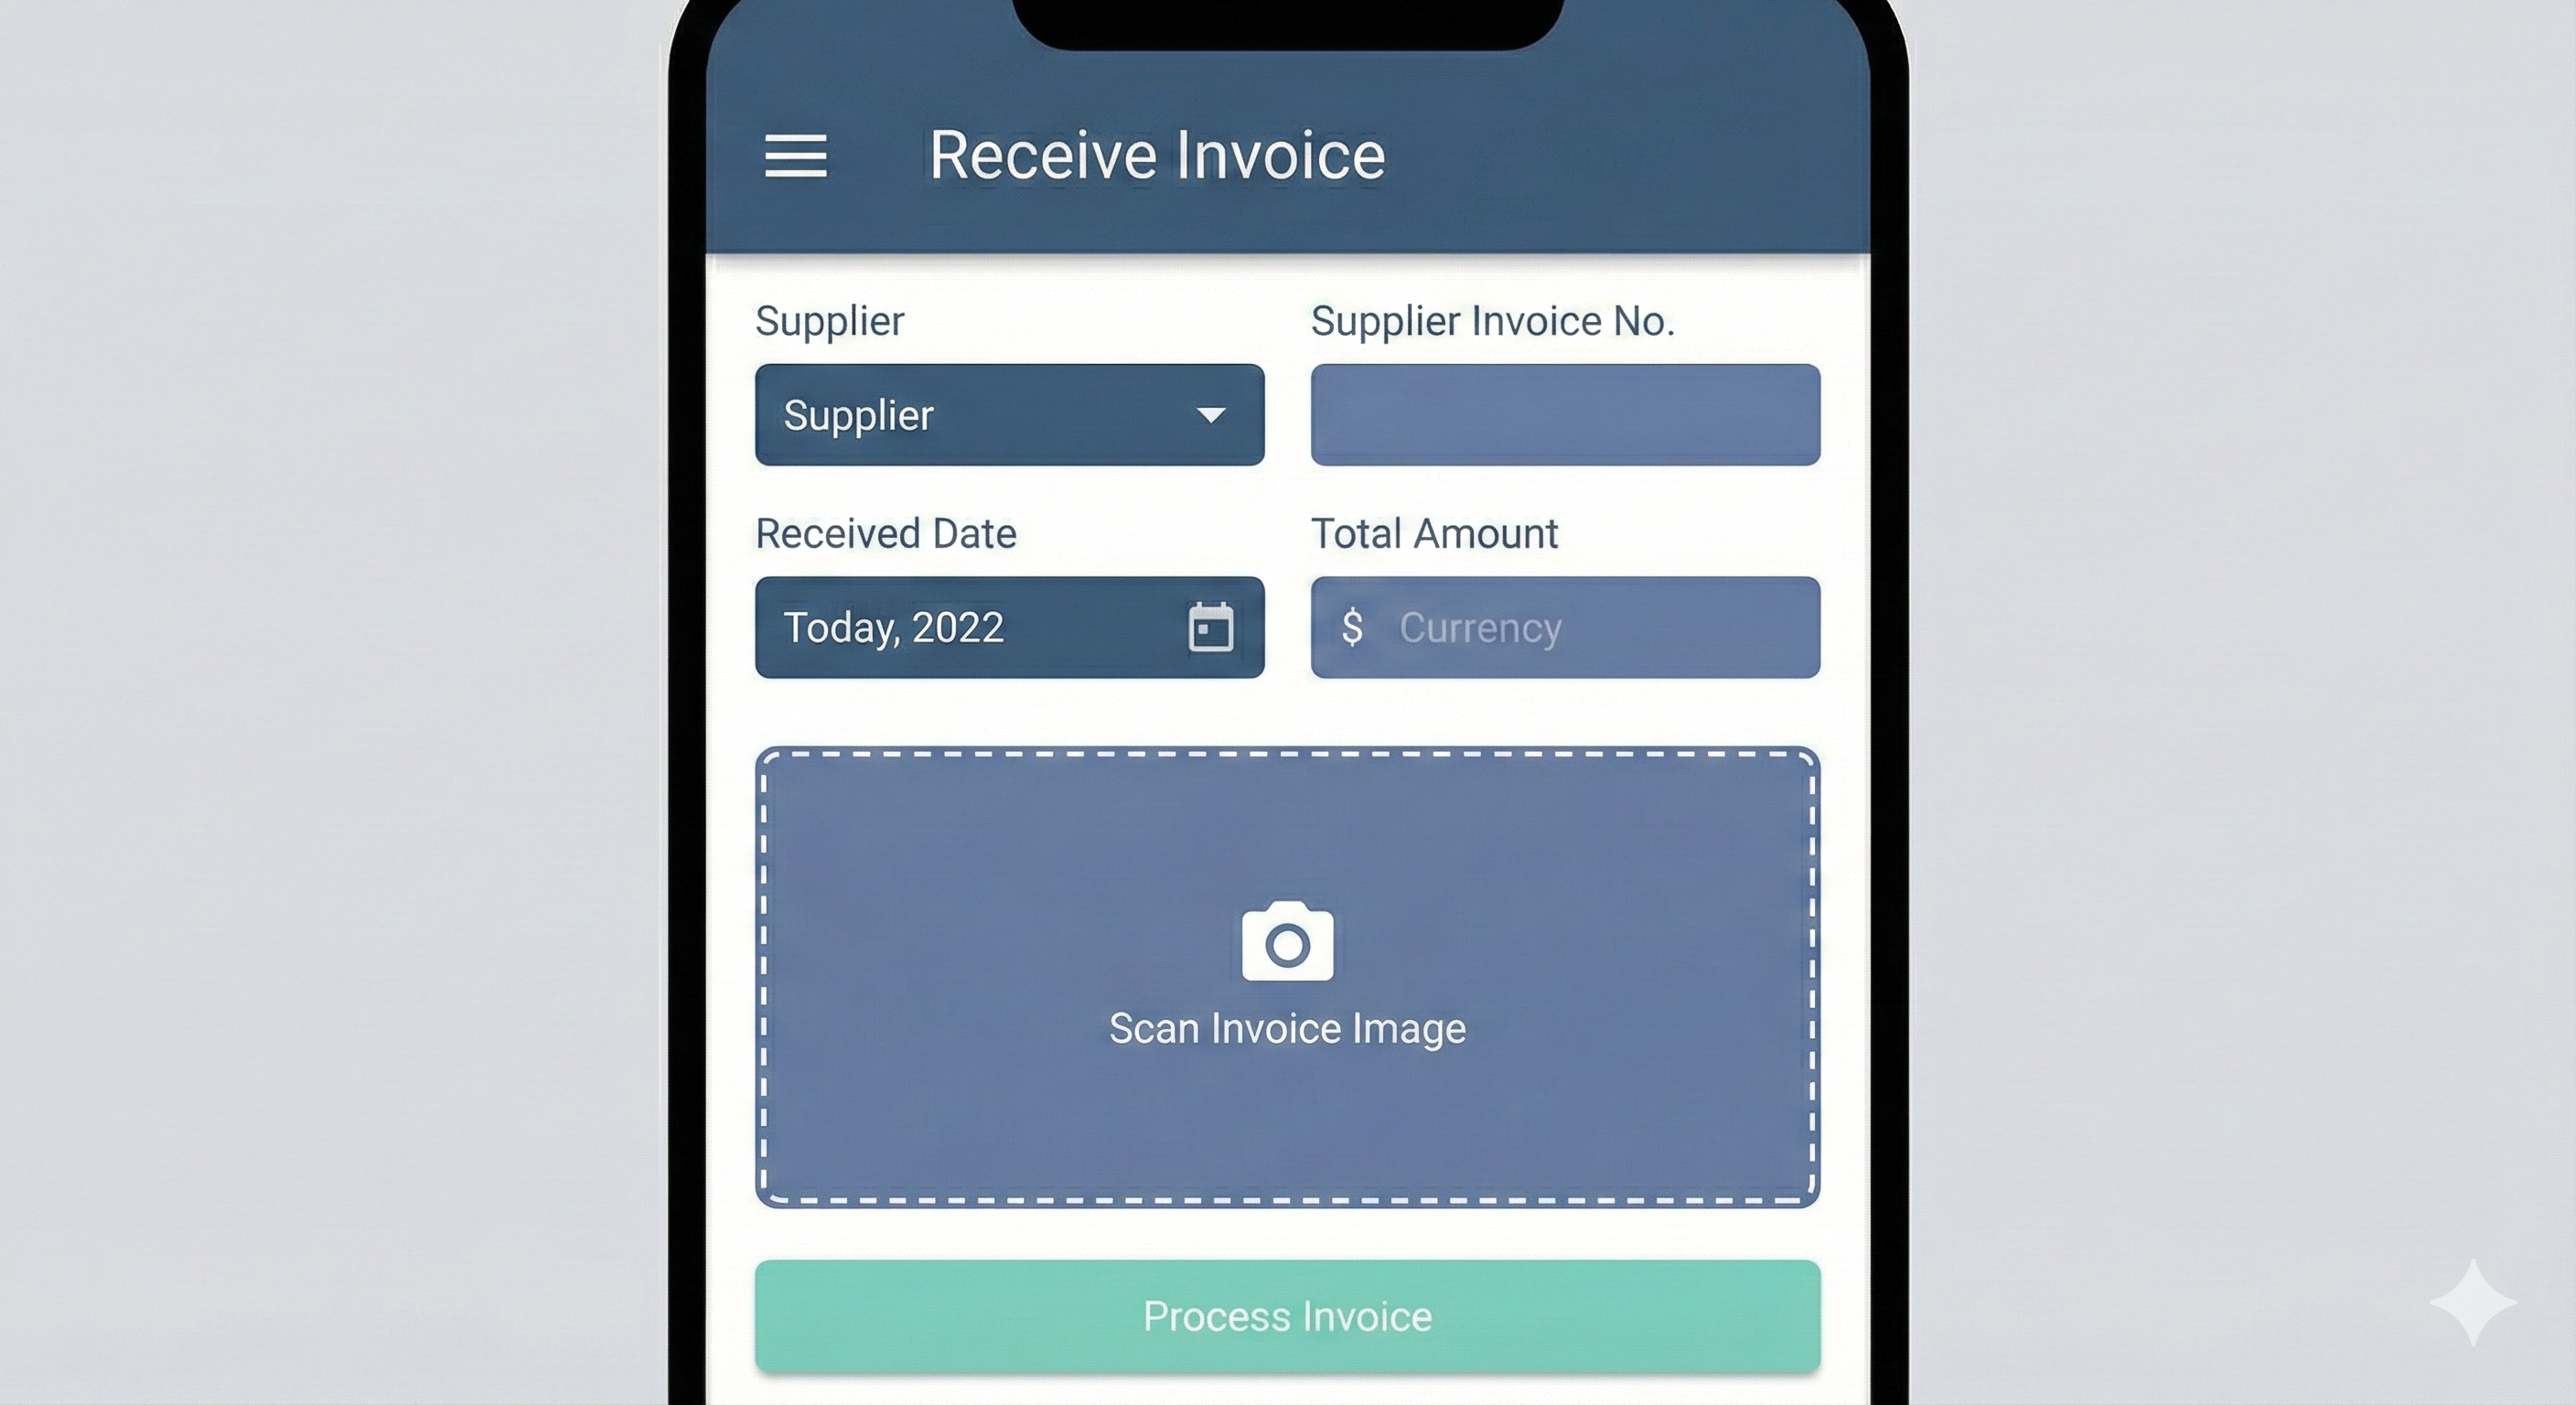
Screen 2.1: Receive New Invoice (Header Capture)
Key Fields: Supplier, Invoice No., Date, Total Amount.
Screen 2.2: Verify Invoice Line Items
Review and correct items extracted by OCR. Editable table for Ingredient, Qty, and Price.
Module 3: Internal Flow
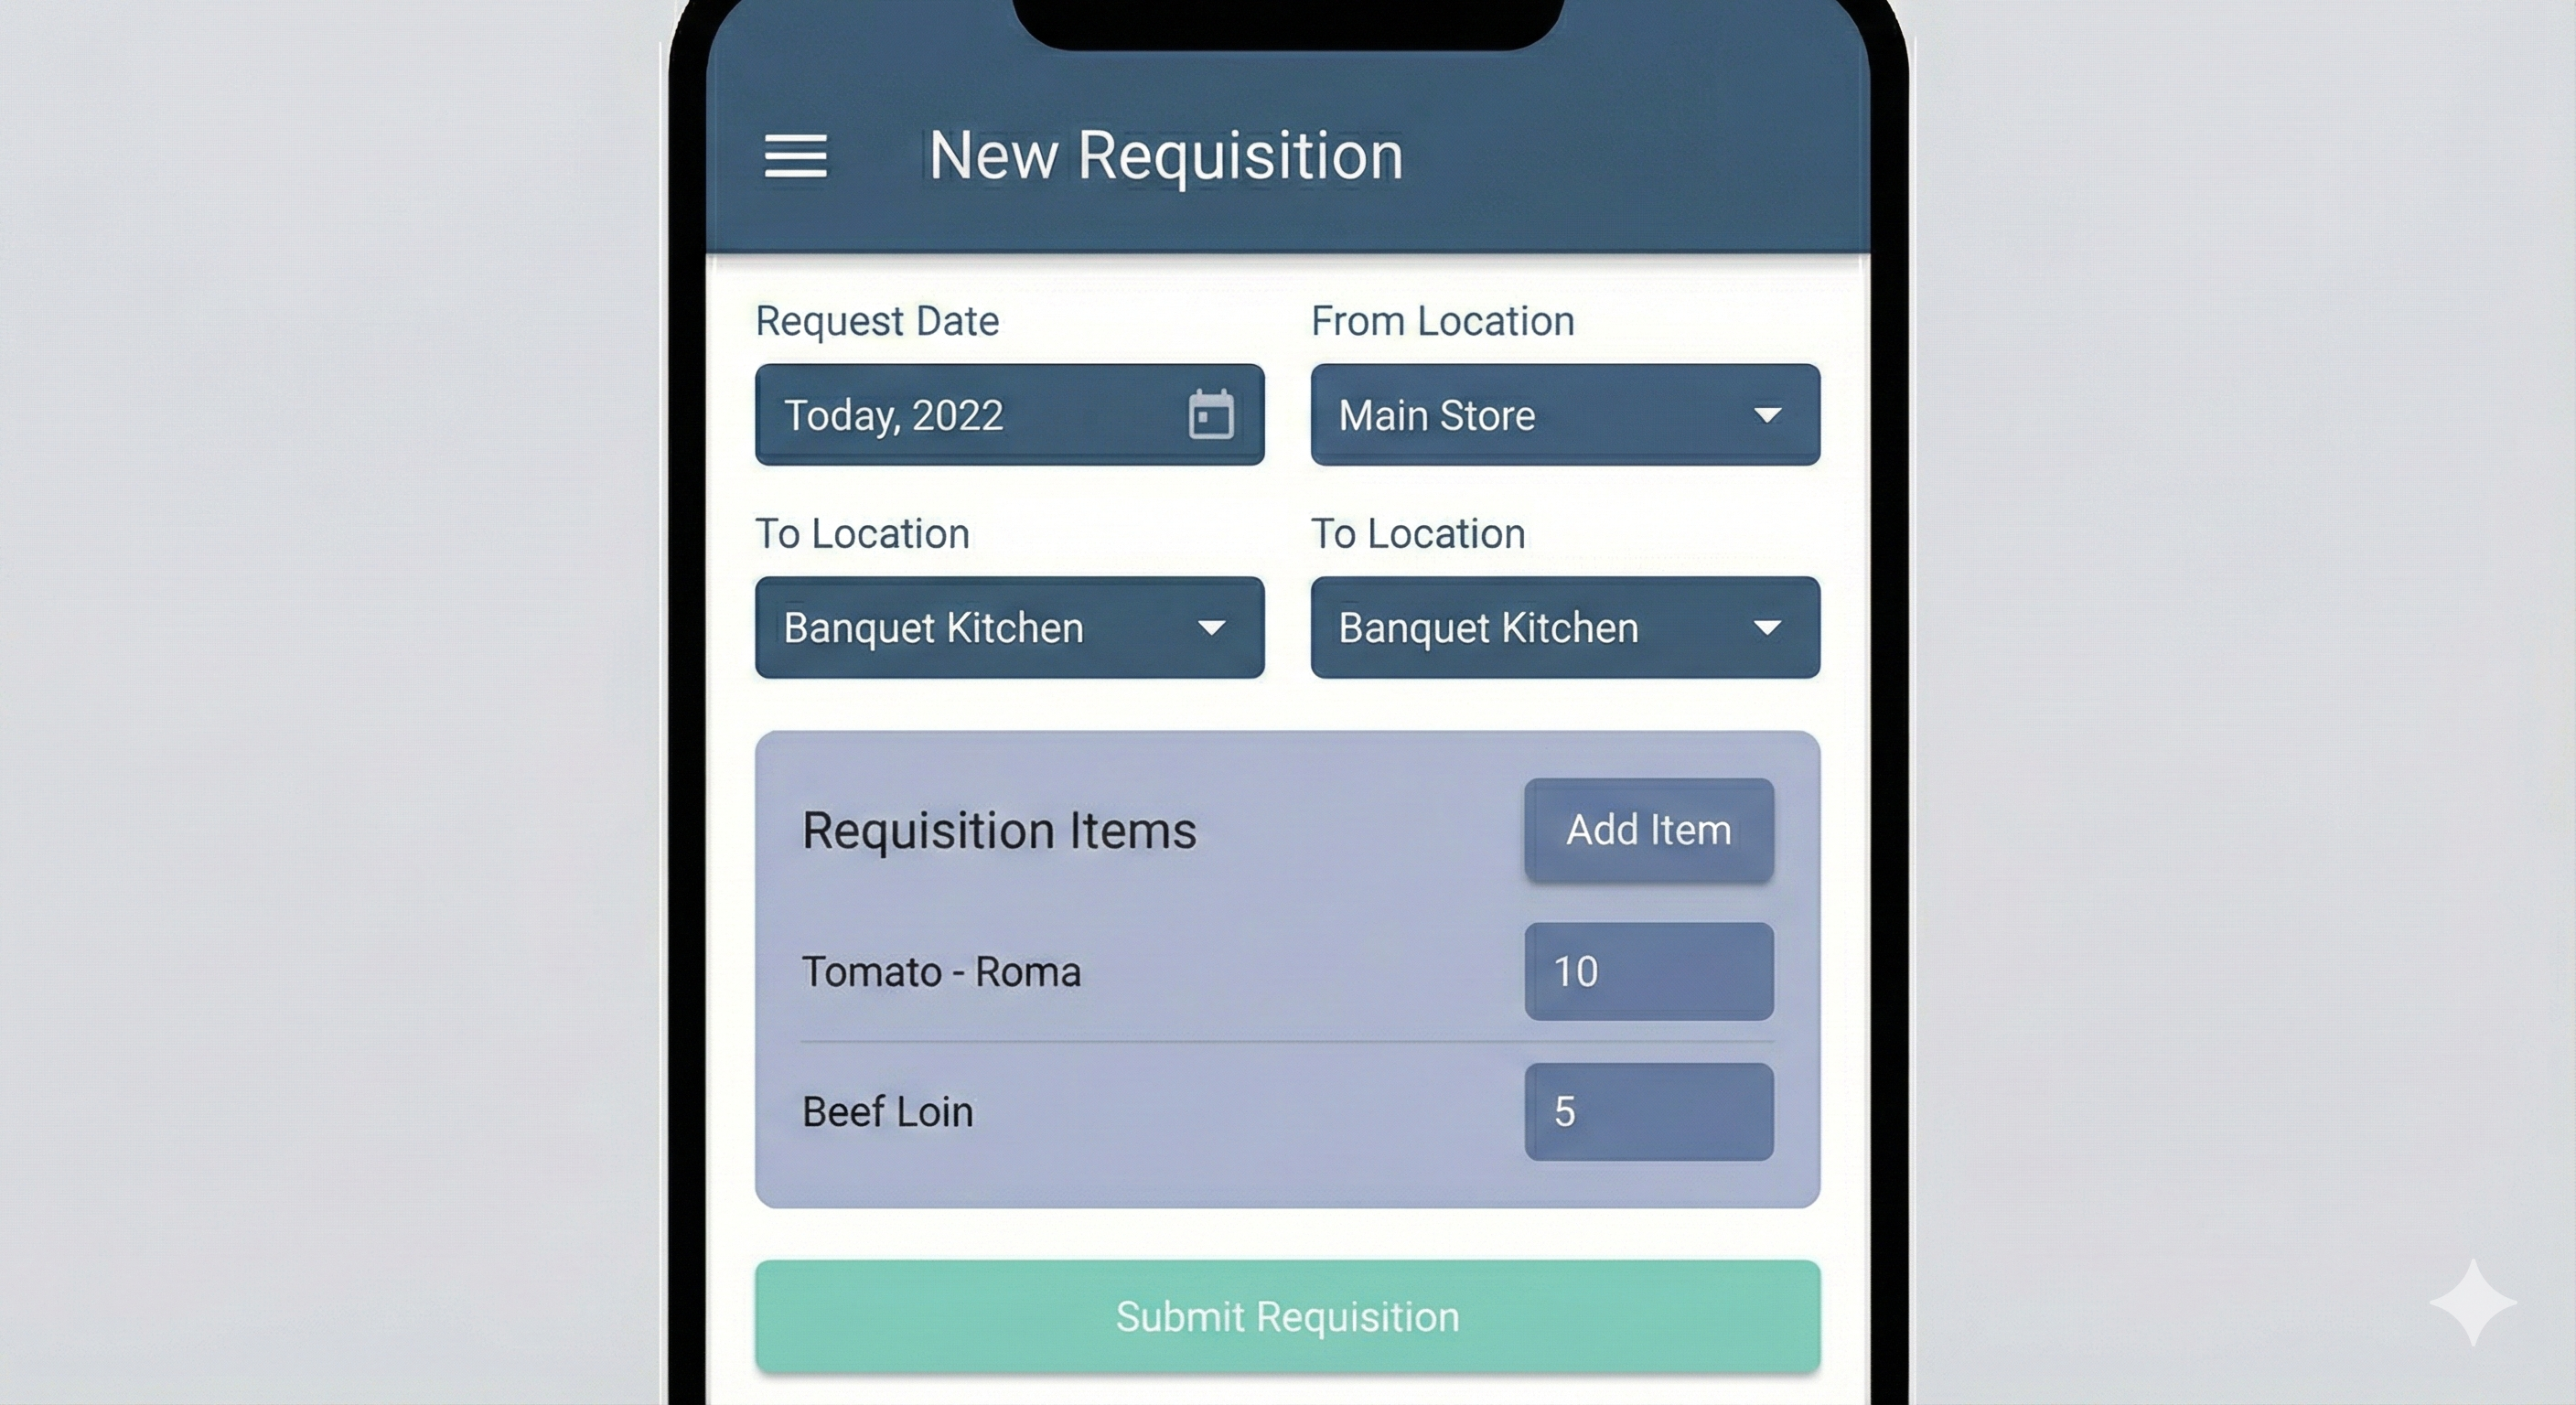
Screen 3.1: Create Daily Requisition
Kitchen staff requests ingredients for the day's production.
Module 4: Waste Management
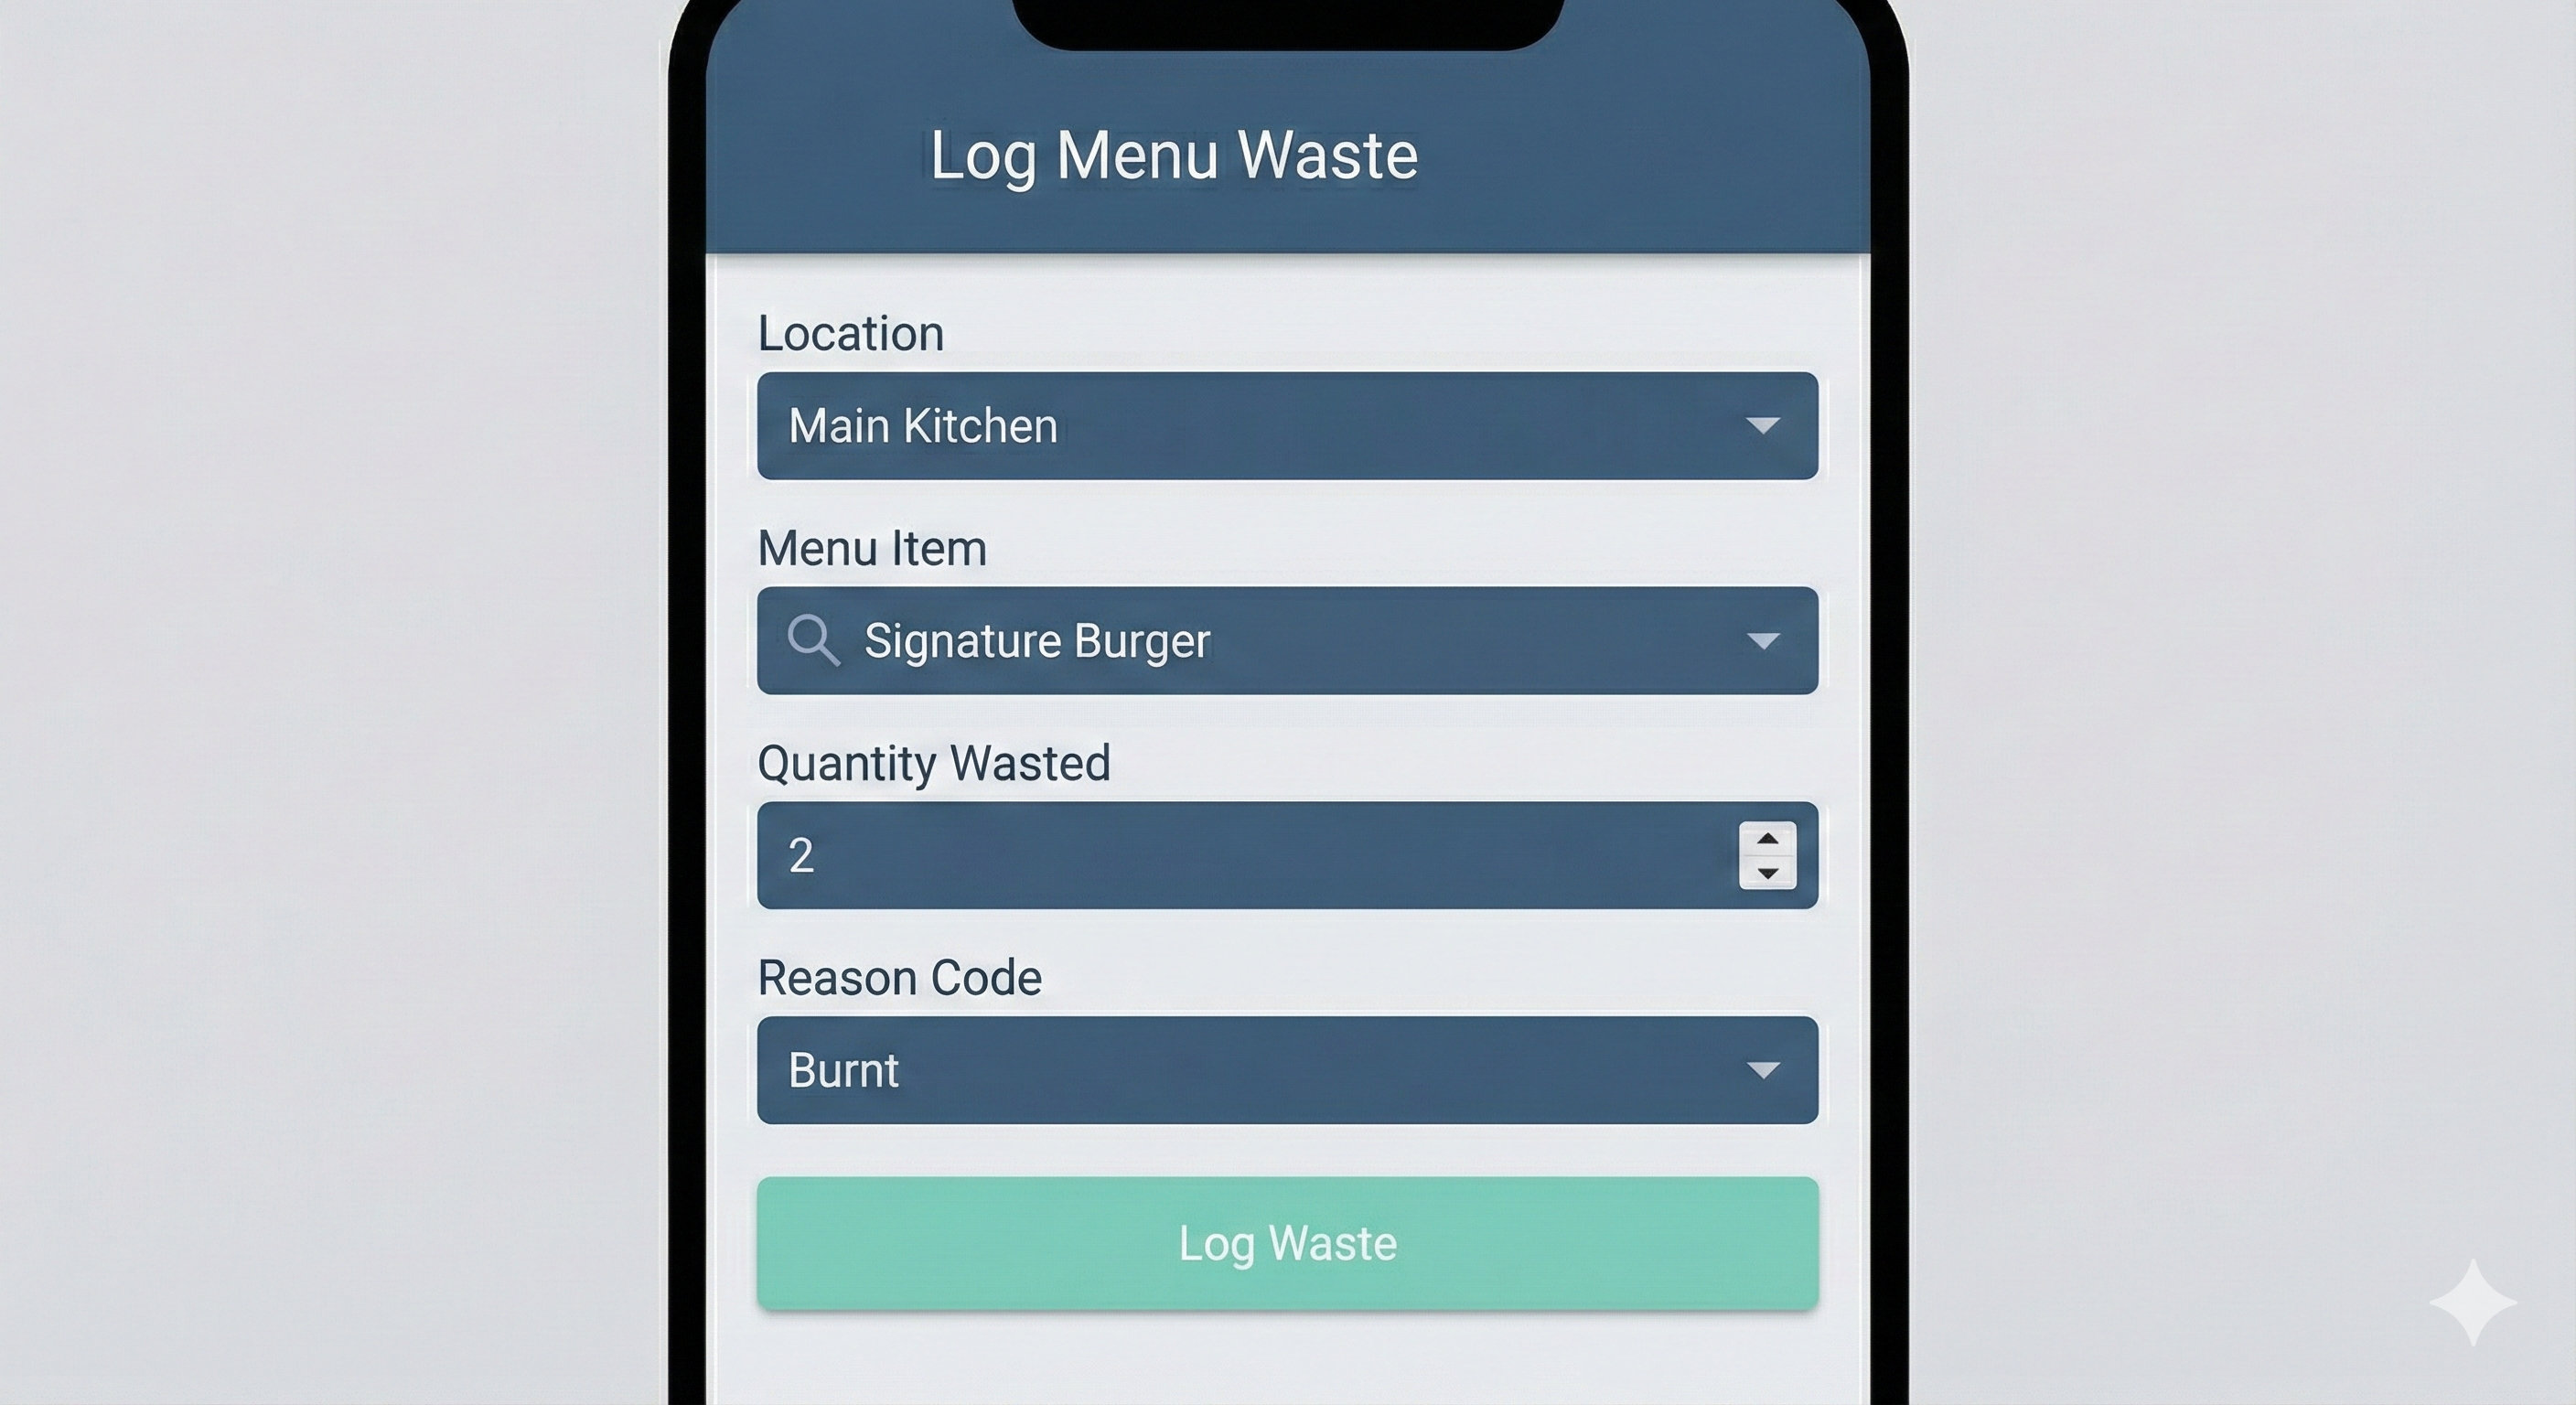
Screen 4.1: Log Menu Item Waste
Quickly record waste of finished dishes. Backend handles ingredient deduction.
Module 5: Verification & Analysis (Staff & Manager)
Screen 5.1: Perform Physical Inventory Count
Mobile/Tablet view for storage audits. Supports Offline Mode and Barcode Scanning.
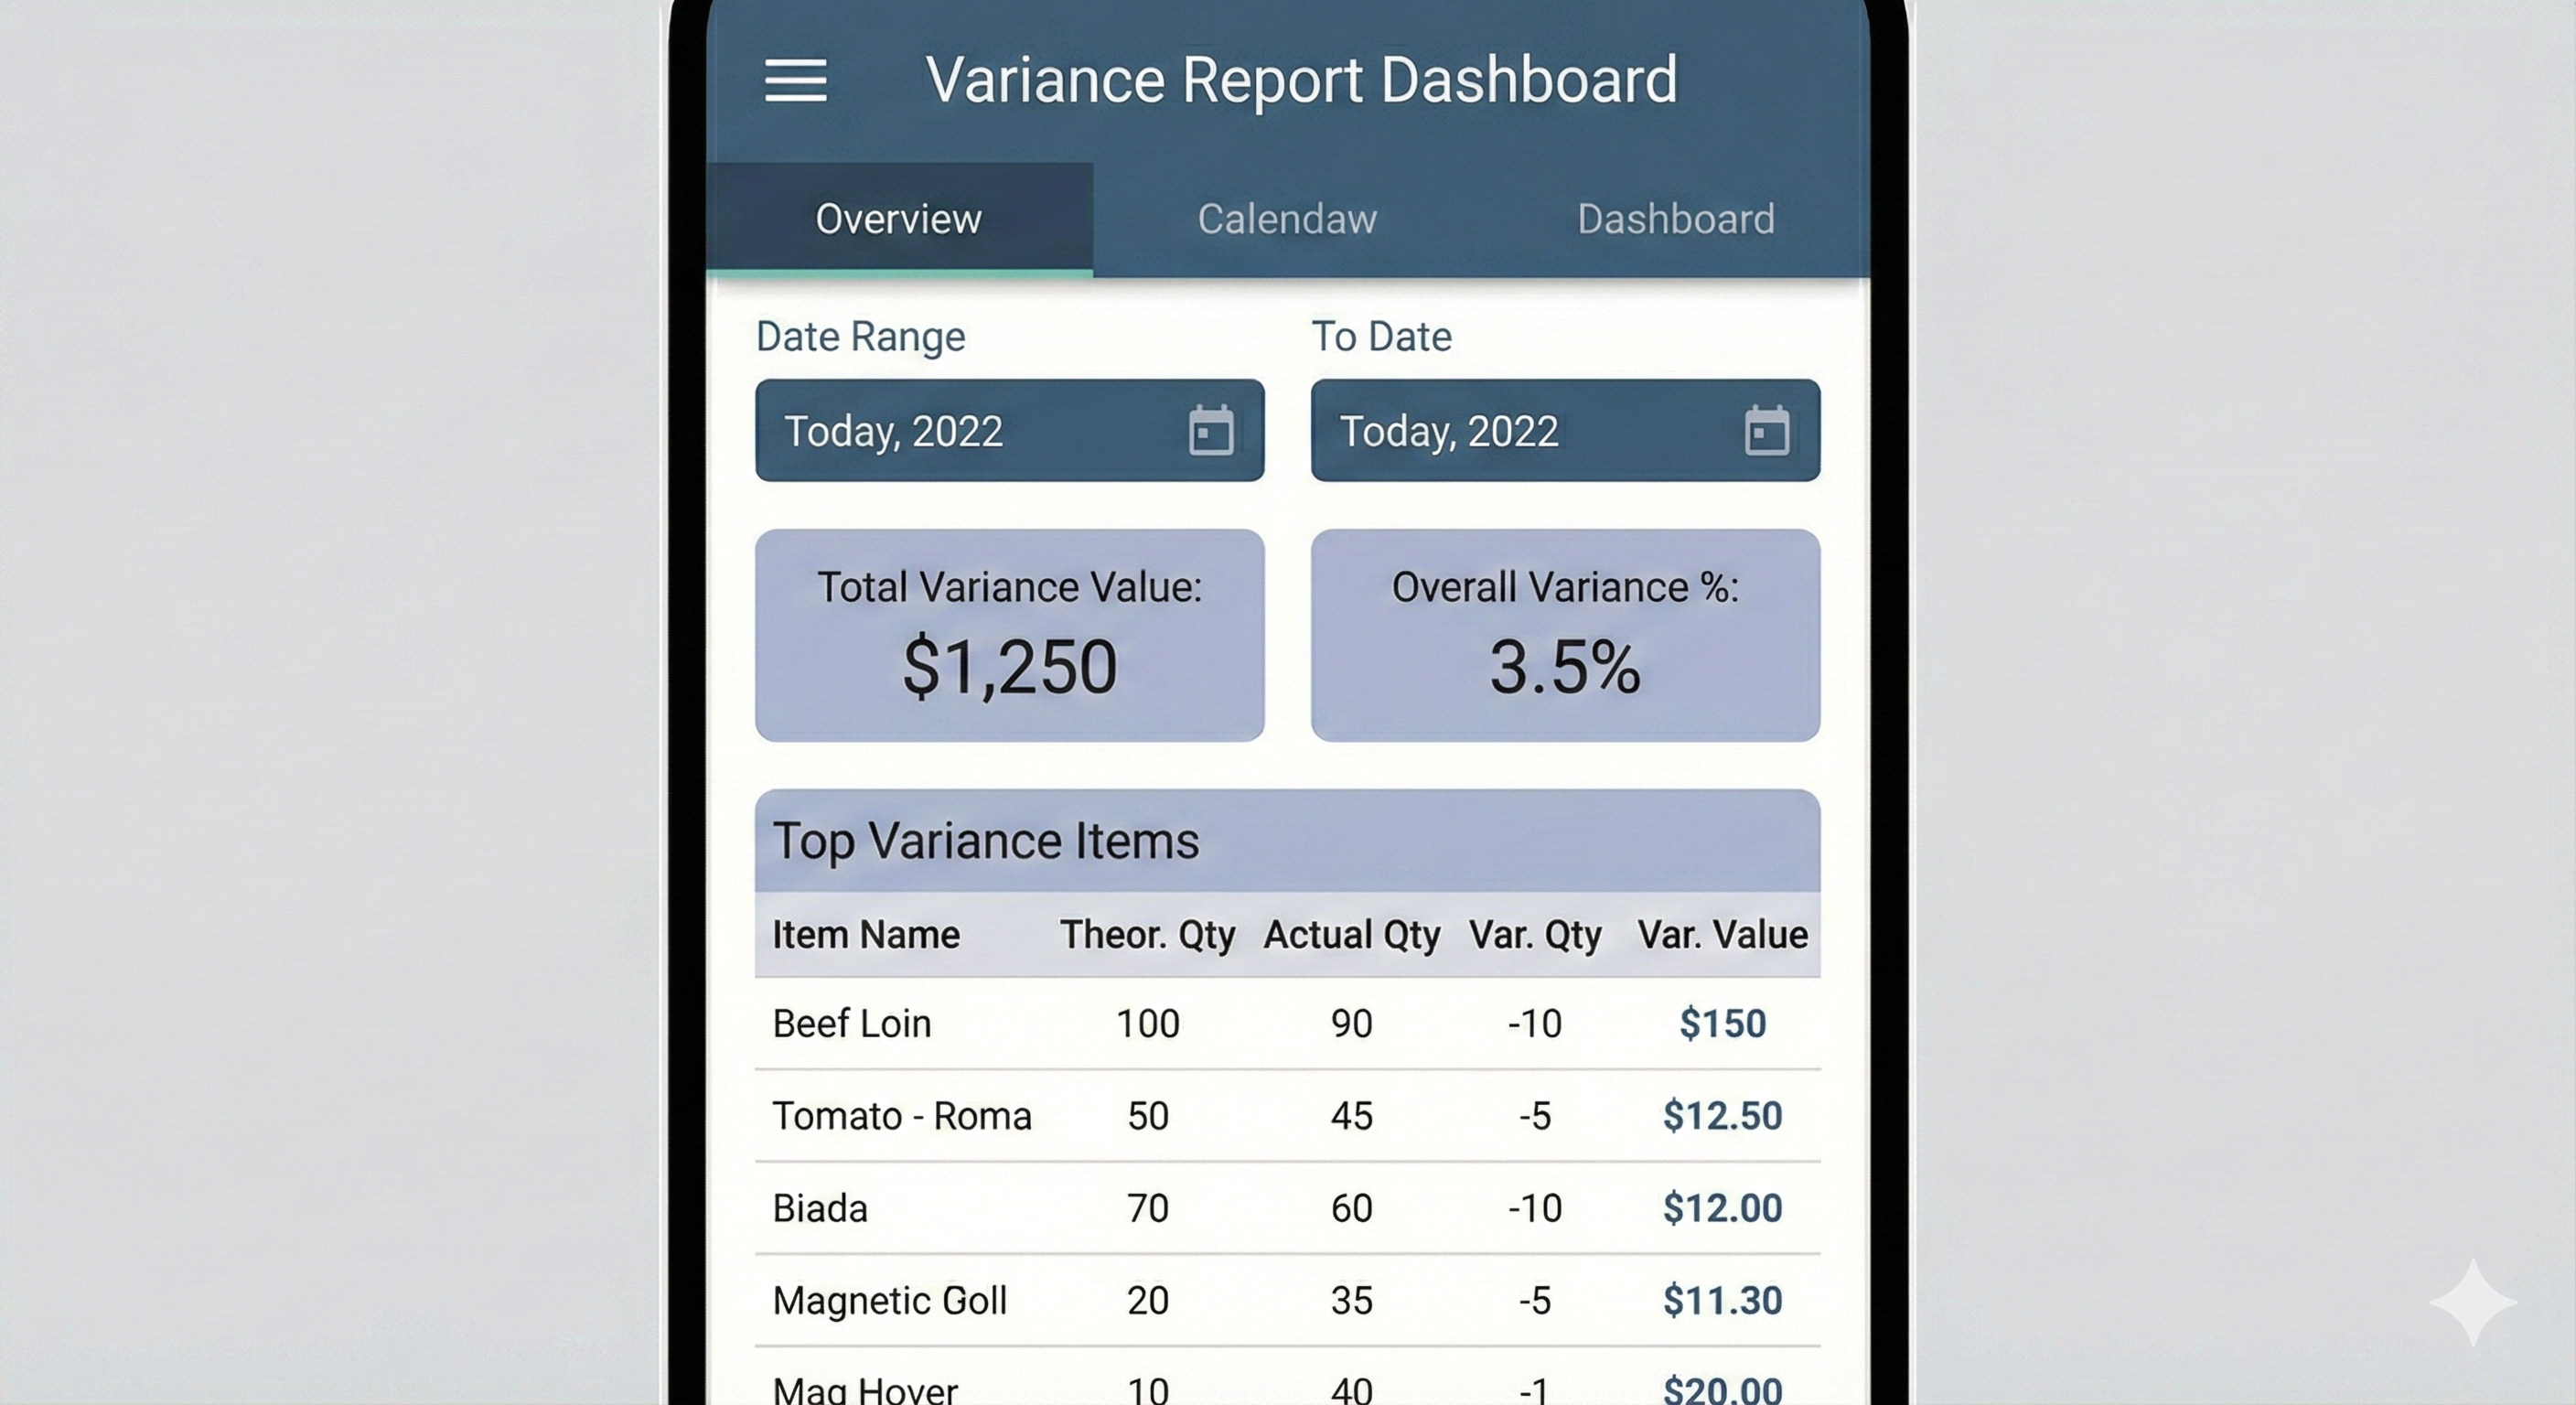
Screen 5.2: Variance Report Dashboard
Top Variance Items table with drill-down capabilities and navigation tabs.
Visual Interface Prototypes
Here are the screen images for the hotel inventory management application, designed based on the Day 3 data model and Day 4 color scheme.
Master Data Management: Ingredient Master List
This screen is for the manager to view, search, and manage the list of raw ingredients.
Inflow Transactions: Receive New Invoice
This screen is used by staff to record goods entering the store. It includes a prominent area to scan the physical invoice.
Internal Flow Transactions: Create Daily Requisition
Kitchen staff use this screen to order their daily supplies from the main store. It features a dynamic list to add multiple items.
Verification & Analysis: Variance Report Dashboard
This is an analytical screen for the manager. It provides a high-level summary of inventory performance and a list of items with the highest variance, with the variance value emphasized.
Waste Management: Log Menu Item Waste
This screen is for kitchen staff to quickly log the waste of finished dishes (e.g., a burnt burger). The backend system will automatically calculate the corresponding ingredient waste based on the recipe.
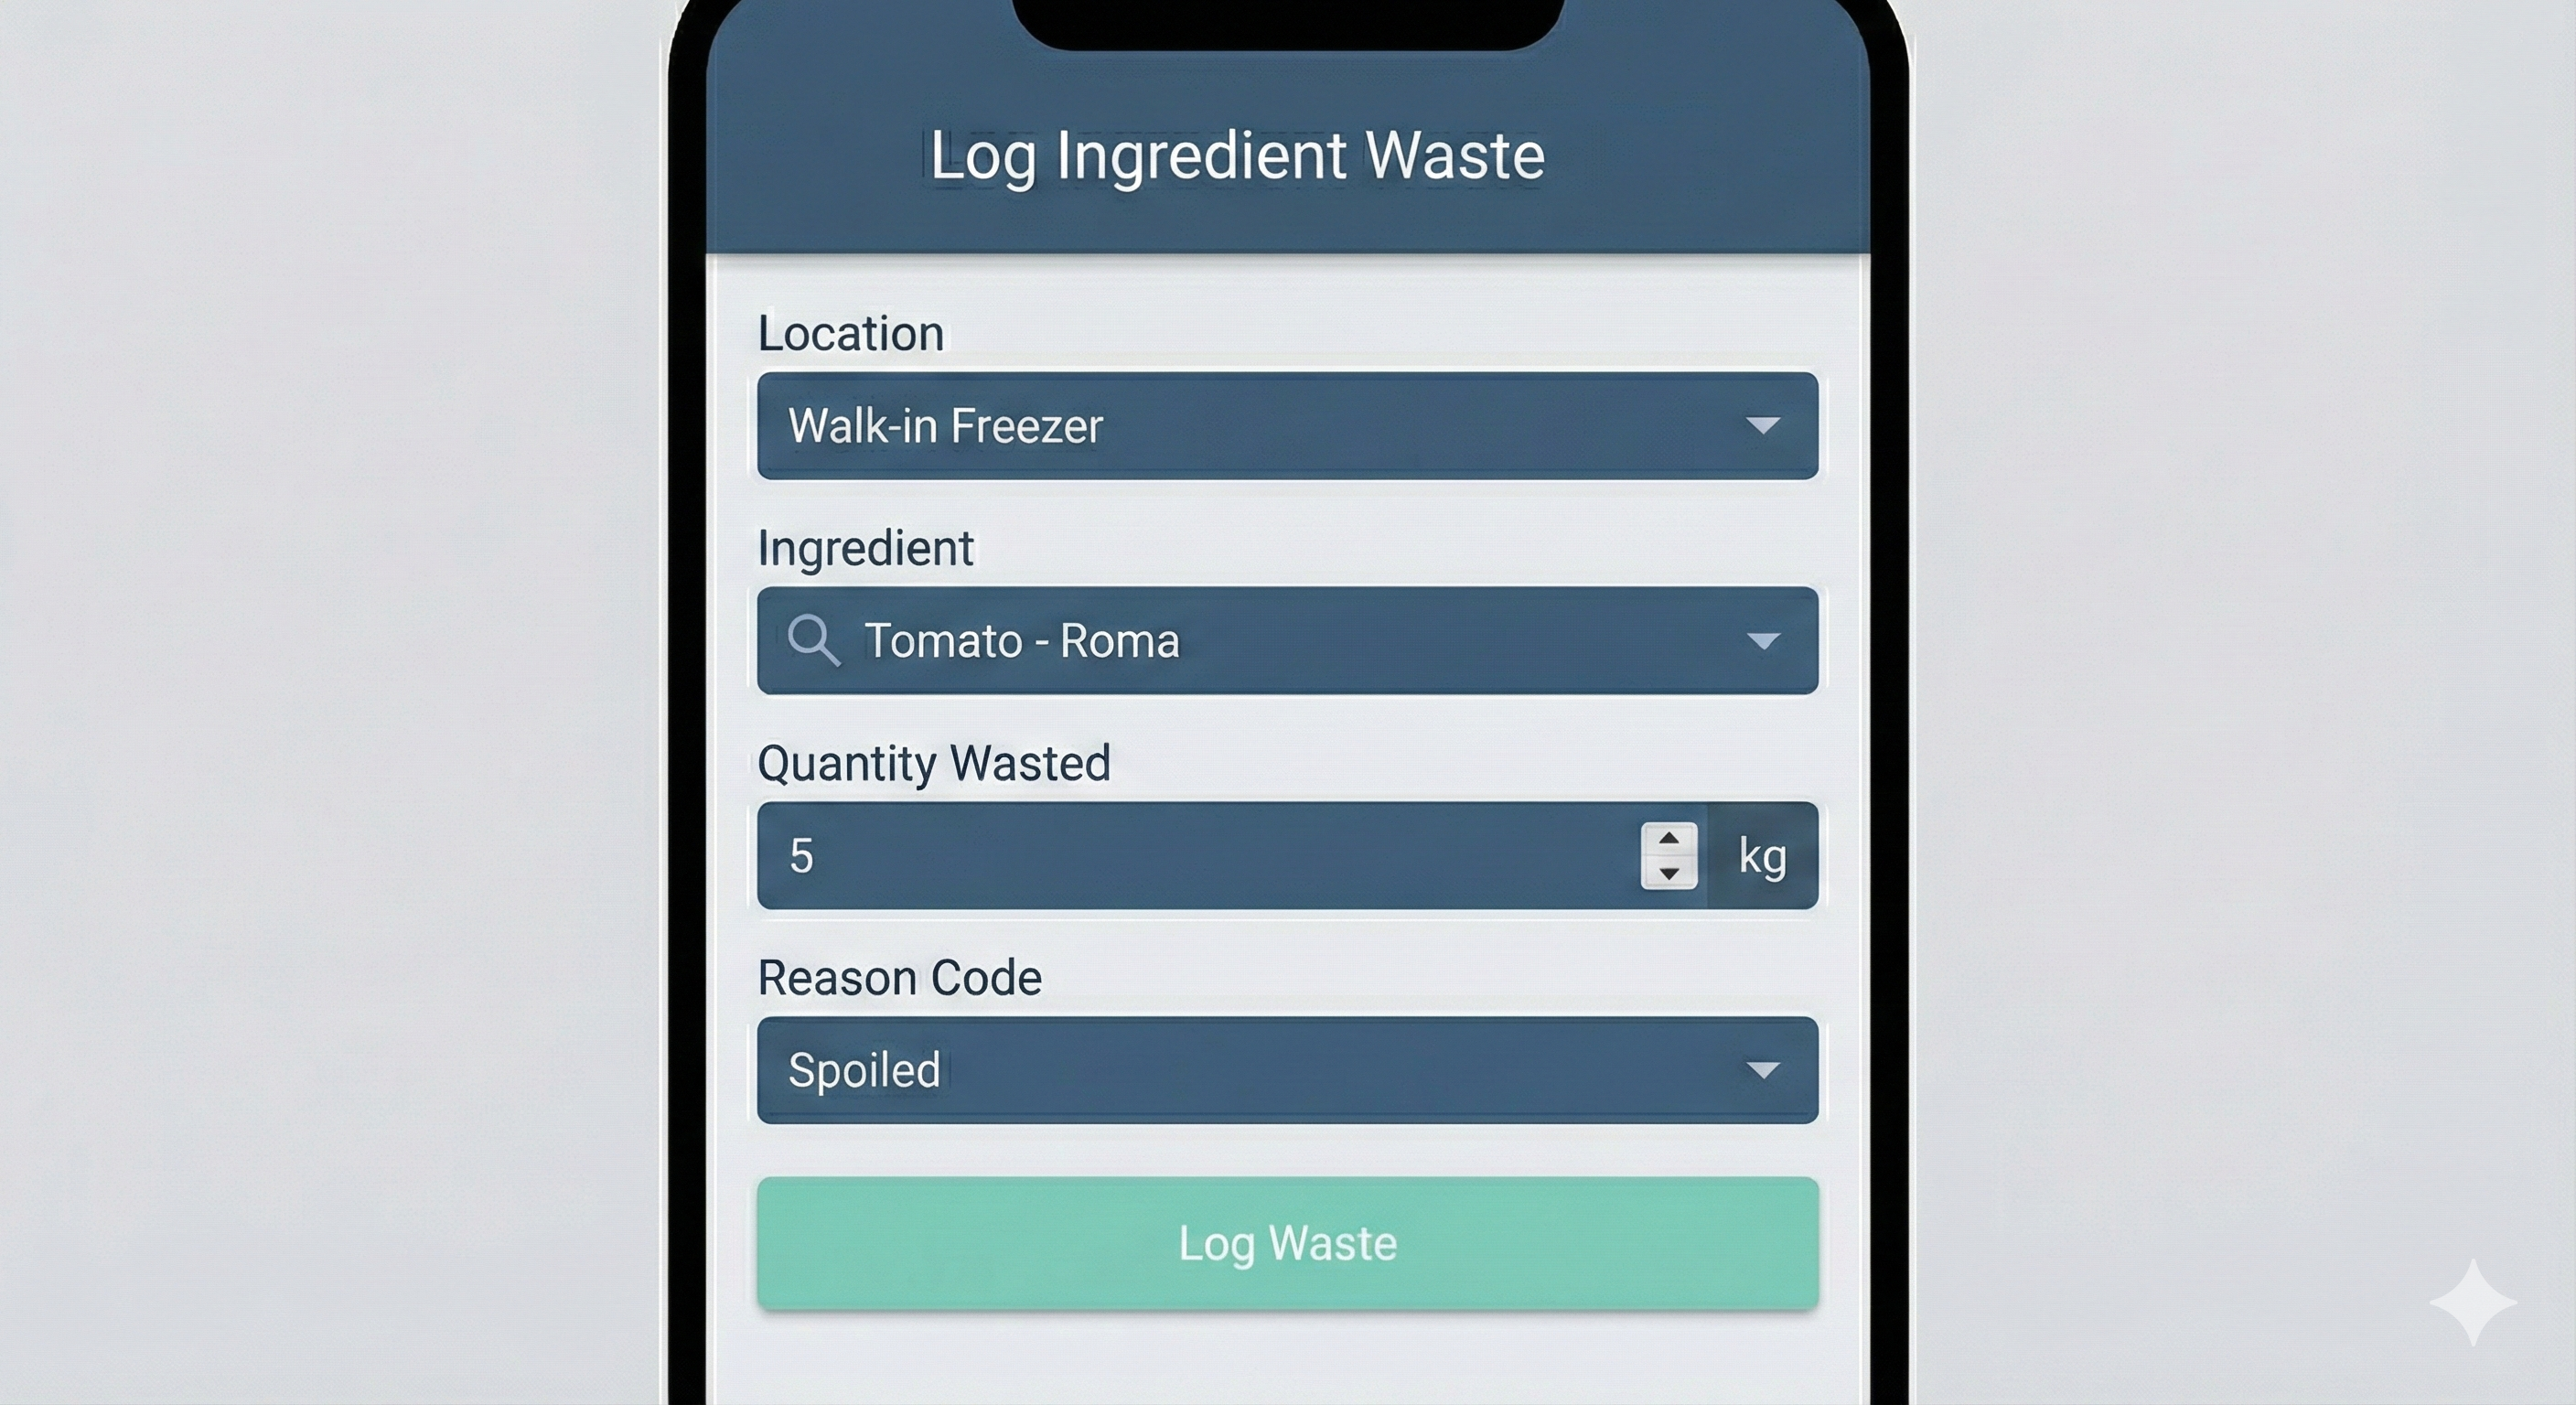
Waste Management: Log Ingredient Waste
This screen is for recording the spoilage or loss of raw ingredients directly from storage (e.g., a dropped bag of flour or spoiled produce). It includes the unit of measure for accurate tracking.
These four screens provide a comprehensive visual representation of the key data capture and reporting functions of your hotel inventory application, all within the specified color scheme.
Operational Summary
The interface prioritizes high-contrast readability and rapid data entry. By using a two-stage waste process and requisition-based triggers, we ensure the backend handles complex calculations while the staff focuses on simple, accurate logging.